New tools available to programs can facilitate collection, management, and analysis of direct assessment data. With these new tools, it is now possible for faculty to assess direct student demonstrations of learning as part of the regular grading process. Data collected in this way can then be automatically analyzed and delivered to those in the program responsible for assessment. When fully implemented, this process has the potential to reduce the amount of time spent on process, and afford programs additional opportunities to use assessment data to guide improvements.
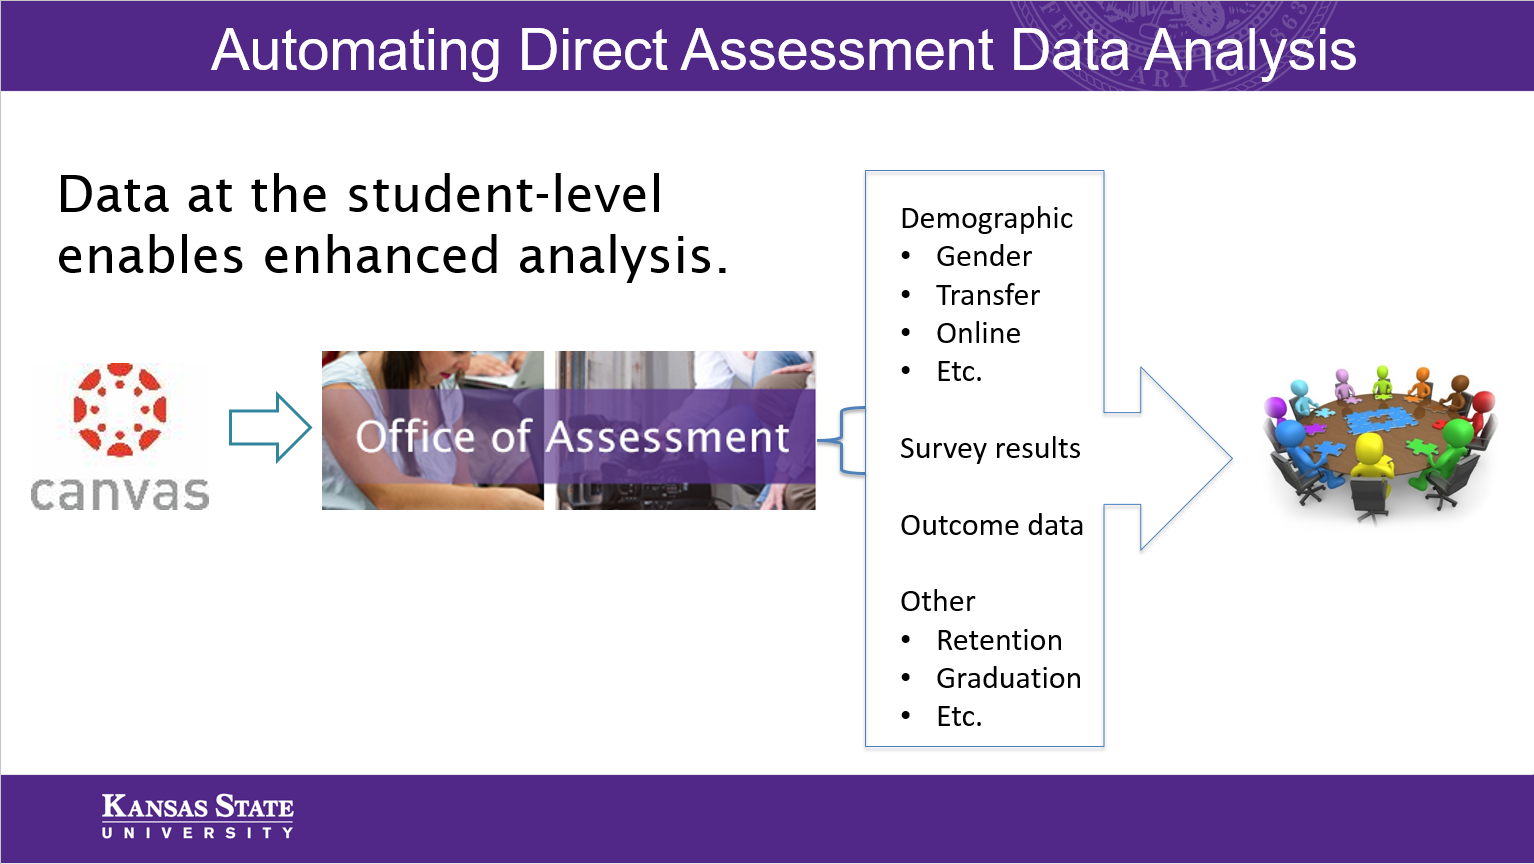 The Office of Assessment can help programs implement these new tools and design custom reports that meet the program’s needs. This article describes using Canvas to collect data, but other options are available. The key is that assessment data is gathered at the student level, which enables connection to other student indicators and metrics.
Using Canvas for Assessment
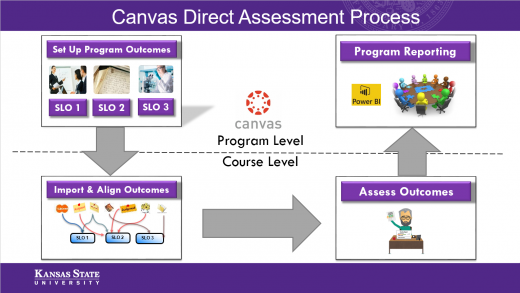
Canvas has several tools to facilitate the collection of direct assessment data. First, learning outcomes must be formulated to work with assessment as part of the grading process. Program outcomes are often either too general or encompass too many skills to work well, so subcomponents for each outcome must be defined. For example, Written Communication could be subdivided into outcomes for content, structure, syntax and mechanics, and grammar. Using subcomponents can provide programs with much more granular results, allowing for more targeted interventions.
 Each outcome also needs a scale indicating the various qualities of achievement students can demonstrate in an assessment. These could be general, such as “exceeds expectations”, “meets expectations”, and “does not meet expectations”. However, validity and reliability are often improved when definitions specific to the outcome are used. The AAC&U VALUE Rubrics illustrate how outcomes can be broken down into subcomponents and specific achievement definitions.
Once outcomes are defined and entered at the program level, faculty can import these outcomes into their courses and use them for assessment. Once faculty score student achievement on their chosen assignment, scores are automatically collected at the program level. Canvas maintains a database of these scores over multiple terms, so formative and longitudinal analyses are possible.
Automating Analysis with Power BI
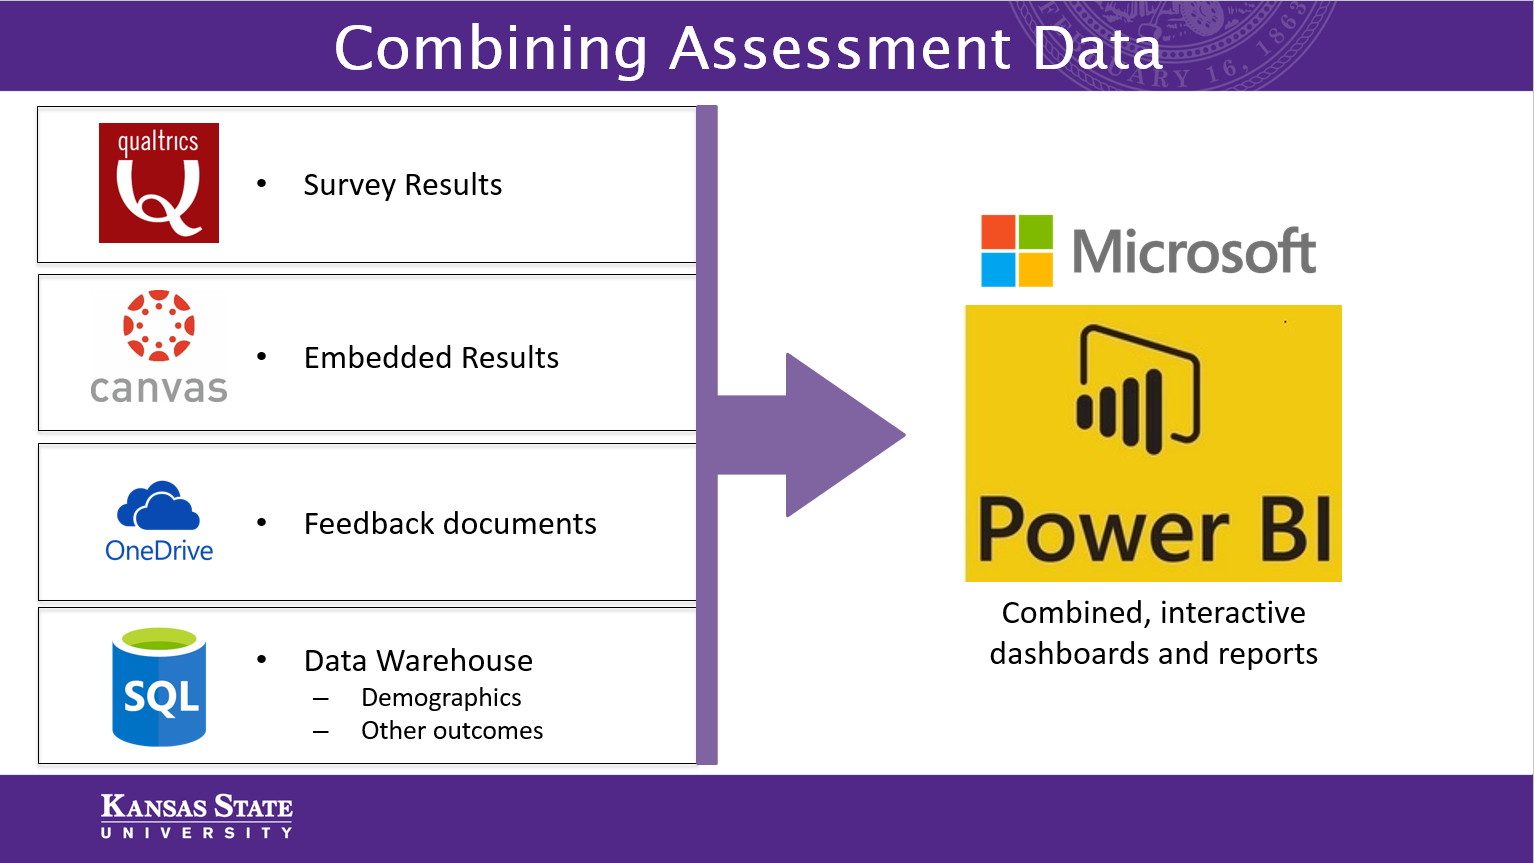
Though Canvas collects the data, it does not analyze or present data in ways that are meaningful for programs to explore possibilities for improvement. Power BI, Microsoft’s data visualization and dashboard tool, can take in data from Canvas, combine it with other data sources, and display rich visuals that allow for deep, meaningful analyses. Such data sources include; indirect assessment data (student responses to surveys), demographics, and other student success metrics (GPA, retention and graduation rates, etc.).
 Programs may believe that particular groups of students are not doing as well as others (for example, students who take online versions of specific courses, or students who enter the major after the sophomore year). Power BI gives programs the ability to see whether their beliefs correspond with reality, and empowers programs to explore additional areas of analysis.
Power BI Sample Report
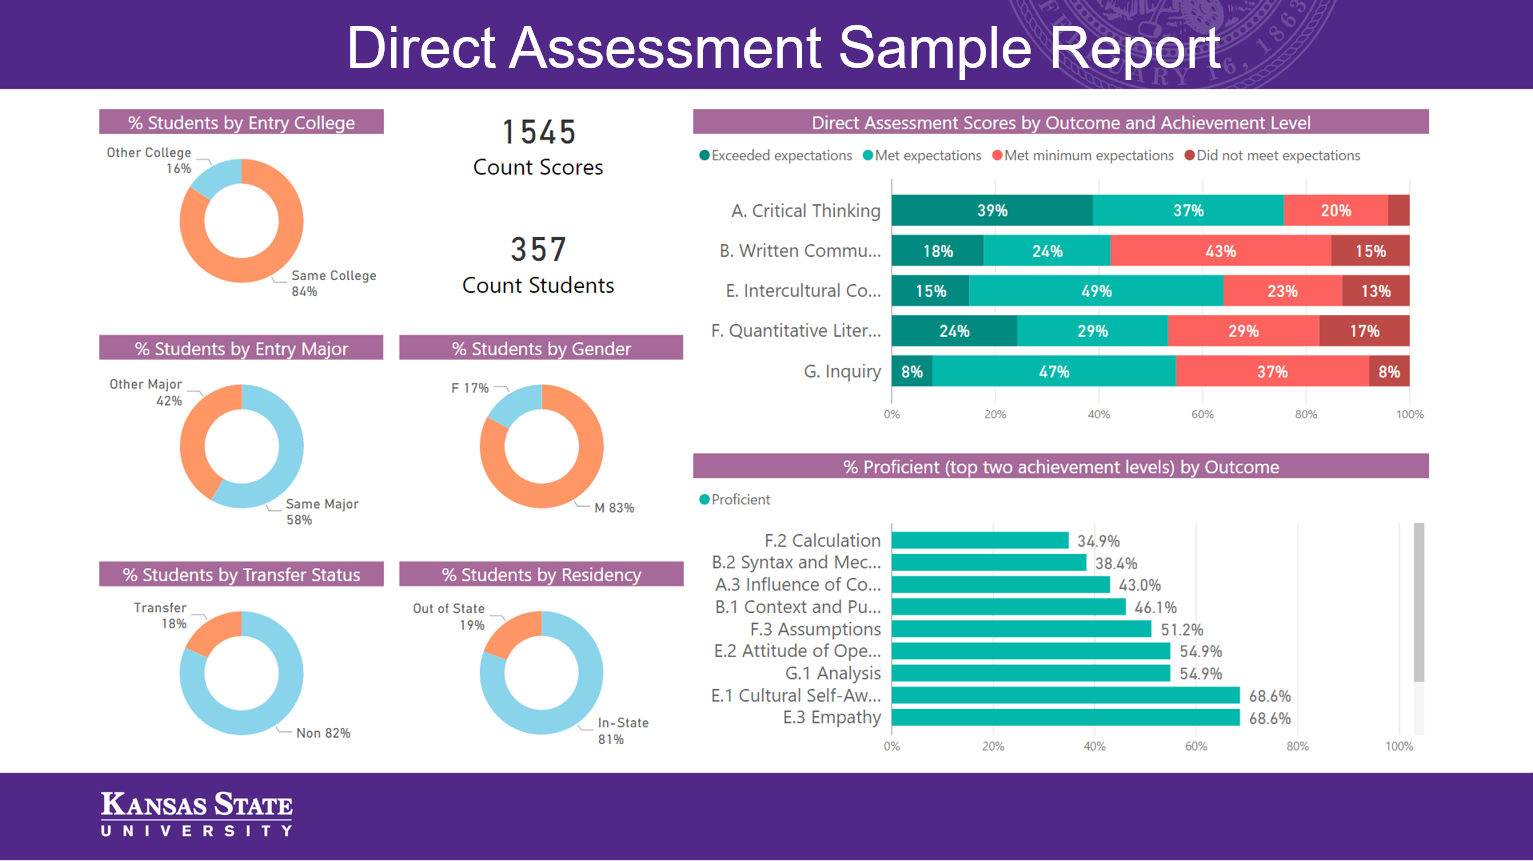
A sample report is available that shows an example of how direct assessment data can be analyzed in Power BI. Interacting with the sample report allows one to appreciate the on-the-fly analysis capabilities of Power BI. For example, one can click on the “Out of State” portion of the residency chart to see outcome results for non-resident students. Additionally, one can click on the double-down arrows at the top of the assessment scores chart to drill down into the sub-components of each outcome. It is important to note that each program’s needs are different, so reports can and should be customized to provide programs with answers to their own unique questions.
 Programs that implement this process can focus on the true purpose of assessment: improvement. By saving time in data collection, programs have more time to focus on discussing results. By connecting direct assessment data to other sources, programs can look at their data in new ways. And by using customized, interactive dashboards, programs can easily answer their own questions and identify previously-unexplored areas for improvement.
The Office of Assessment is here to assist programs in exploring and setting up processes that work to make assessment more meaningful to faculty as they work to improve student learning. Contact us at assessment@ksu.edu to get started.
