Beef Tips

Author: Hannah Williams

September 2018 Management Minute

“Coaching in the Workplace”

By: Justin Waggoner, Ph.D., Beef Systems Specialist

Being a manager and managing people isn’t easy, especially when an employee or group of employees’ performance needs improvement. The goal of coaching is to improve the quality of the work of the employee or group and is not necessarily part of a disciplinary action (although it is often associated with it). Coaching in the workplace can be an effective way to address issues that limit performance. Below are a few tips from www.thebalancecareers.com on coaching in the workplace.

 State the issue or the problem directly. Keep the focus on the issue or problem and not the person.

 Involve the employee in the process. Asking the employee or group for help in creating a solution is a great way to show you have confidence in them.

 Identify what issues or road blocks exist that limit the employee or group’s performance.

The most common issues are time, additional training or resources.

 Come up with plan that identifies specific actions that need to be taken to address the issue by everyone involved (including the manager).

 Schedule time for a follow-up conversation. Feedback is essential, but should be positive.

For more information, contact Justin Waggoner at jwaggon@ksu.edu

December 2018 Feedlot Facts

“Mud Season….Again”

By: Justin Waggoner, Ph.D., Beef Systems Specialist

Many locations in Kansas have experienced wet conditions this fall. Thus, I thought this article by Chris Reinhardt, former Extension Feedlot Specialist, was worth sharing.

Consider the humble Box Blade — As a feedlot nutritionist, you’d think my favorite piece of equipment or technology would be the steam-flaker, the feed mixer, or the small-ingredient inclusion system. No. I love the box blade.

Why? Because the nutritionist owns performance. BRD belongs to someone else, but when closeouts are chronically below expectations, the nutritionist often takes the heat.

As we come into a wet winter, lots can become muddy, and mud has devastating impacts on performance.

Cattle need a (relatively) dry, comfortable place to lie down. If excessive moisture has resulted in destruction of the mound, it’s time to run the box blade. Cattle that cannot rest do not perform.

Cattle should have 20-25 square feet of mound area on which to lie down. The top surface (5-10 feet wide) of the mound should be crowned side-to-side, and longitudinally the mound should also have a mild grade similar to the direction of the general slope of the pen, which is normally between 1 and 6%. The sides of the mound should have a slope of 1:5 to enhance drainage yet still allow cattle to lie on the surface.

The end of the mound should connect directly to the concrete bunk pad so that, especially during muddy conditions, cattle can move freely and easily between the mound and the bunk and water areas. This will encourage both feed consumption and resting behavior, both of which will enhance performance during and after inclement weather.

For more information, contact Justin Waggoner at jwaggon@ksu.edu.

November 2018 Feedlot Facts

“Forage Analysis: What Numbers Do I Need?”

By: Justin Waggoner, Ph.D., Beef Systems Specialist

One of the more common questions I receive with regard to analytical testing of forages and other feedstuffs is, “I have the sample, now what do I test for or what analysis package should I select?”

The basic components that nutritionists need to evaluate a feedstuff or develop a ration are dry matter or moisture, crude protein, an estimate of the energy content of the feedstuff (Total Digestible Nutrients (TDN)), Net Energy for Maintenance (NEm), Net Energy for gain (NEg), and the macro minerals, Calcium and Phosphorous. These are the most basic numbers that are required, but including some additional analyses in the report can give us additional insight into the quality of the feedstuff or improve our ability to predict animal performance, which is the primary reason we analyze feedstuffs. I recommend that the report include acid detergent fiber (ADF) and neutral detergent fiber (NDF). The amount of NDF in forage reflects the amount of cell wall contents (hemicellulose, cellulose and lignin) within the sample. The NDF fraction is often associated with the respective bulkiness of forage and is correlated with dry-matter intake of the forage or feedstuff. Therefore, the amount of NDF may be used to estimate the expected dry-matter intake associated with the forage. The ADF number represents the amount of cellulose and lignin within the forage and is correlated with the respective digestibility of the forage. In general, a higher ADF value is associated with forage that has a greater proportion cellulose and lignin and would likely be more mature. Additionally, the ADF fraction is used to calculate the energy estimates TDN, NEm, and NEg that appear on the report. There are a number of different mathematical equations that the testing laboratory may use to calculate these numbers, based on the type of sample (corn silage, alfalfa, grass hay, etc.). If the ADF is included in the report, the nutritionist can adjust or recalculate the energy estimates if necessary.

If the forage will be fed in combination with a byproduct feed such as wet distiller’s grain, including an analysis for sulfur can be beneficial if the forage will be used in a growing or feedlot ration. Additionally, if the forage is a known nitrate accumulator (forage sorghums, sudangrass) or may have been stressed due to drought, including a nitrate analysis should always be considered, especially if the forage will be fed to pregnant cows.

Most analytical laboratories have a number of different analysis packages which encompass the most common procedures or numbers that a nutritionist or producer needs to know about their feeds. These packages will typically include the basic procedures (DM, CP, TDN) and then add on specific analyses such NDF, or the Macrominerals (Ca,P, Mg, K, Na, Cl, S). Some laboratories may group analysis packages by the type of sample (forage vs. mixed ration) or production purposes (dairy vs. beef).

The objective of analytical testing of forages and feedstuffs is to improve our ability to meet the animal’s nutrient requirements and ultimately predict animal performance. The unequivocal best method of evaluating the quality of a feedstuff is feeding the feedstuff to an animal and evaluating performance over a set period of time, under a specific set of conditions. Since that would not be cost effective or timely, analytically evaluating feedstuffs in a laboratory is the next best thing and although it is not perfect, it is unequivocally better than the “this looks like really good stuff” method of evaluating feedstuffs.

For more information, contact Justin Waggoner at jwaggon@ksu.edu.

October 2018 Feedlot Facts

“Preconditioning for Profit”

By: Justin Waggoner, Ph.D., Beef Systems Specialist

Vaccine and antimicrobial technologies continue to improve at a breakneck pace. Yet we continue to see that calves that are unprepared for life in the feedlot and which undergo significant stress during and after weaning en route to the feedlot will have morbidity upwards of 30% and first treatment success is often only about 50%. Calves that get mild respiratory disease in the feedlot will have 0.2-0.4 lb. lower ADG and those calves requiring multiple treatments for respiratory disease will gain 0.6 lbs less for the entire feeding period. This translates to about 15 lb. less carcass weight and 10-15% fewer choice carcasses. It pays to keep calves healthy. Preconditioning can mean different things to different people, from giving calves a single vaccination prior to weaning, all the way up to two full rounds of vaccination, before and after weaning, weaning the calves from their dams for 45 to 60 days, and transitioning the calves onto a total mixed ration, eating from feedbunks, and drinking from waterers. As far as animal performance is concerned, the extent of preconditioning needed to minimize problems at the feedlot and maximize feedlot performance depends on the extent of stress imposed on the calf during transition. Studies at K-State suggest that single-source calves shipped four hours to a feedlot will benefit from preweaning vaccination, weaning and feeding for at least two weeks before shipment to the feedlot. However, if calves are going to be shipped more than eight hours from home, they will be commingled with other sources of calves either in transit or upon arrival at the feedlot, and are likely to experience adverse weather conditions during the transition period to the feedlot, vaccination and weaning for six to eight weeks before shipment would be preferred. Investing time, technology, and labor into the calf crop has very real costs for the rancher. But the high purchase price of weaned calves entering the feedlot means the financial risk of respiratory disease and the uncertainty that respiratory disease causes feedlot producers has very real costs as well. Many feedlot producers are willing to pay ranchers a premium to mitigate some of the disease risk that causes the feedlot economic uncertainty — consider it “biological risk management.” When certified preconditioned calves are sold at special preconditioned calf sales, they have the potential to bring significant premiums over non-preconditioned, “commodity” calves. Respiratory disease is the most costly disease in the cattle industry, and the greatest factor affecting calf performance in the feedlot. If you can prevent or control disease, you can, to a certain extent, control performance of calves. Feedlots are paying premiums for calves that are prepared for life at the feedlot. Why? Because they perform and are predictable — predictability is the opposite of risk. As a rancher, you can and should be paid for your investments of time, money and management. For more information, contact Justin Waggoner at jwaggon@ksu.edu.

September 2018 Feedlot Facts

“Estimating Placed Cost of Gain Using the Focus on Feedlots”

By: Justin Waggoner, Ph.D., Beef Systems Specialist

The K-State Focus on Feedlots has many uses. Foremost, it provides many of us that are not directly connected with the cattle feeding industry a means of staying abreast of cattle performance and closeout data from commercial feeding operations. Additionally, the data generated may be used to build economic budgets for cattle producers considering retaining ownership or placing a group of cattle on feed. One of the common questions that come up in these discussions is “what the projected cost of gain will be?” One of the simplest ways to estimate placed cost of gain is to look at the relationship between reported corn price and reported projected cost of gain for steers and heifers. The data obtained from the Focus on Feedlots from 2015, 2016, and 2017 is shown in the graphs below.

The relationship between corn price and placed cost of gain is expressed in the following formulas: Projected Steer Cost of Gain ($/cwt) = $22.32 + ($14.09 x Corn Price). Projected Heifer Cost of Gain ($/cwt) = $21.16 + ($15.21 x Corn Price). These formulas may be used to forecast the projected cost of gain if corn price is known. For example, when corn is $3.50/bushel, cost of gain for steers equals $71.64/cwt ($22.32 + $14.09 x $3.50). Based on this formula, cost of gain will increase $14.09/cwt for every $1.00 per bushel increase in the price of corn. The incremental cost of gain for heifers is slightly higher ($15.21 vs. $14.09) for every $1 per bushel increase in the price of corn. The table below lists the projected cost of gain at various corn prices from $2 to $7 per bushel. The intercept values ($22.32 and $21.16 for steers and heifers respectively) reflect other costs associated with feeding cattle (e.g., labor, equipment, and facilities).

There are many factors that influence cost of gain, primarily cattle performance (ADG, feed conversion. etc.) which is not necessarily taken into account with this method. However, this does provide a simple method that can easily be adjusted up or down to fit specific groups/types of cattle and expected weather conditions during the feeding period. For more information, contact Justin Waggoner at jwaggon@ksu.edu.
August 2018 Feedlot Facts

“Cull Cows: A Disappointing Failure or Marketing Opportunity:

By Justin Waggoner, Ph.D., Beef Systems Specialist

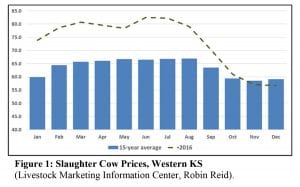
Most cattle operators view open cows with some degree of disappointment. However, you might be surprised at the amount of revenue that can be realized from cull cow sales. I recently summarized the Kansas Farm Management data on Kansas cow-calf operations from 2010-2015. Participating operations had an average herd size of 126 head, weaned an 84% calf crop, sold 106 calves and 20 head of breeding stock or cull animals annually. In the 2015 data, the average gross income of participating operations was $118,710, the sale of breeding stock or culls generated $28,453 of that figure. Thus the sale of cull animals accounted for 24% of the participating operations gross income. Although marketing cull breeding stock/cows is often viewed as a loss, it is a significant source of income that should not be overlooked. Most cull cows are sold through local auction markets. Therefore, understanding the market and making timely marketing decisions is one of the most important components of realizing the most dollars out of a cull cow. The figure below illustrates the 15-year average and 2016 slaughter cow prices in Western Kansas.

Slaughter cow prices tend to be highest and relatively steady from February to August, and then decline rapidly, being lowest in the months of October, November and December. Essentially, the worst time to market a cull cow based on the seasonal nature of the market aligns with pregnancy determination and weaning on most spring-calving operations. Therefore, if open cows are identified in late summer and are in good condition, marketing those animals as soon as possible would likely result in a higher price than waiting until later in the fall. If open cows are identified later in the fall, deferring marketing until late winter/early spring and placing cull cows on low-input feeding program that would add additional weight and condition (provided resources are available) might be more advantageous than marketing those animals immediately.

For more information, contact Justin Waggoner at jwaggon@ksu.edu.

August 2018 Management Minute

“Five generations in Today’s Workplace”

By Justin Waggoner, Ph.D., Beef Systems Specialist

I recently learned that there are approximately five generations currently in the American workforce. I would add that since farmers and ranchers don’t often retire and the kids start doing chores at an early age there could possibly be up to six generations involved in the day-to-day activities of a farm or ranch. These generations are somewhat loosely defined across different sources as 1) WWI and WWII generation (born ~1901-1926); 2) Mature or silent generation (born ~1928-1945; 3) The Baby Boomers (born ~1946-1965); 4) Generation X (born ~1965-1980); 5) Millennials (born ~1980-2000); and 6) Generation Z or Centennials. All of these groups have defining characteristics and ideals that make them unique. There is a tremendous amount of differences between these generations, if we consider that Granddad may have been raised in a world with limited electrical conveniences, and the millennial grandson has never experienced a world without computers or mobile hand-held communication devices. Have you given any consideration to the different age groups or generations that currently make up your workforce? Have you updated your policies, procedures or verbal expectations to include modern means of communication such as texting? For example, if a family member or an employee is going to be late, is it acceptable to send a text? If it is a more formal organization, what about training materials? Millennials and the Generation Z’s (coming soon) likely prefer and are more engaged in something they can watch over printed material.

For more information, contact Justin Waggoner at jwaggon@ksu.edu

July 2018 Feedlot Facts

“Feedlot Heifer Performance in 2017”

By Justin Waggoner, Ph.D., Beef Systems Specialist

Each year I retrospectively summarize the data from the K-State Focus on Feedlots in an effort to document annual trends in fed cattle performance. The Focus on Feedlot data for heifers from 2017, 2016 and 2015 is summarized in the table below. Overall, the number of heifers marketed increased in 2017 with approximately 8,400 more heifers being marketed in 2017 than 2016. Heifer in weights were lower, averaging 729 lbs in 2017. Final weights of heifers were on average 30 lbs lower in 2017 at 1,252 lbs, compared to 1,282 lbs in 2016 and 1,266 lbs in 2015. Heifer days on feed increased to 160 days, an increase of 6 days relative to the 154 days reported in 2016. Heifer average daily gain and feed conversion was similar across years. Death loss increased to 1.64% relative to 1.46% in 2016, but was similar to the 1.62% reported in 2015. Total cost of gain for heifers was $3.17/cwt lower in 2017 than 2016. Heifer cost of gain was $3.76/cwt greater on average than that of steers, $74.34/cwt versus $78.10/cwt.

For more information, contact Justin Waggoner at jwaggon@ksu.edu.
July 2018 Management Minute

“The New Hire”

By Justin Waggoner, Ph.D., Beef Systems Specialist

You have decided to bring a new person into your organization. How do you bring them on-board and get them up to speed with how your organization operates? Do you have a formal training process or do you simply put them to work and hope the new team member is a quick learner?

Regardless of the size of your business or operation, training new people is important. The onboarding process sets the new hire up for success from day one and is an essential component of employee retention. Some surveys suggest that approximately 30% of new hires will leave their current position within 6 months. Lack of job training or a poor on-boarding process are some of the most common reasons cited for leaving an organization. Good employees are hard to find. Creating a strategy for training new employees that teaches them how to do their job and how your business operates (including ethics, culture, etc.) is well worth the effort.

For more information, contact Justin Waggoner at jwaggon@ksu.edu.

June 2018 Feedlot Facts

“Feedlot Steer Performance in 2017”

By Justin Waggoner, Ph.D., Beef Systems Specialist

Each year I retrospectively summarize the data from the K-State Focus on Feedlots. In an effort to document annual trends in fed cattle performance. The Focus on Feedlot data for steers from 2017, 2016 and 2015 is summarized in the table below. In 2017, participating feedlots marketed 358,092 steers, approximately 39,000 more steers than were marketed in 2016. In weights were slightly lower in 2017, averaging 796 lbs. Final weights of steers were notably lower (34 lbs) averaging 1387 lbs compared to 1416 lbs and 1421 lbs in 2015 and 2016, respectively. Steers were on feed approximately 164 days, an increase of five days from 2016. Average daily gain and feed conversion were similar across years. However, death loss did increase slightly to 1.52% relative to the 1.36% previously reported in 2016. Reported total cost of gain averaged $74.34/ Cwt. in 2016, which was $2.98./Cwt. lower than 2016 and $10.82/Cwt. lower than 2015.

For more information, contact Justin Waggoner at jwaggon@ksu.edu.