Water is one of the precious resources on the planet. As surface water supply has become less reliable and predictable, we rely more and more on groundwater.
Within the past decades, the management and exploration of this hidden resource become increasingly challenging. One of the main reasons for this challenge is the limited amount of data about its availability, current state, and use. Since we cannot manage what we don’t measure, having reliable data is indeed critical.
To be able to obtain a more accurate image of the aquifers structure, Dr. Claudia Adam in collaboration with Dr. Saugata Datta has developed a method to constrain water migration in aquifers through time-laps microgravity data. This non-invasive and cost-efficient method can complement the existing methods, and even provide supplementary information about the groundwater flow direction.
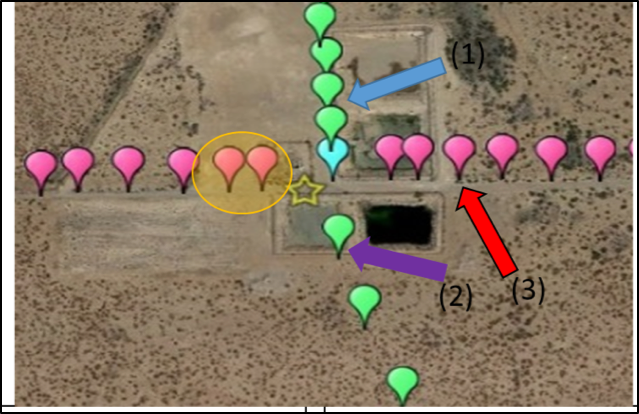
Erik Patton, MSc student working with Dr. Datta, assisted by Dr. Adam and Kayleigh Rogers (MSc student working with Dr. Kempton and Dr. Adam,, completed two gravity surveys along the HBA aquifer in El Paso, Texas, during June and November 2017. Gravity measurements have been done along two perpendicular profiles (Fig. 1).
 The changes in gravity are reported in Figure 2. The gravity change is in the order of 0.2 mGal (200 µGal) corresponding to a 4.8 m water level change between June 2017 and November 2017. The changes in gravity occur near the recharge basins. Water is mounding beneath the recharge basins whenever there is water inside. However, the induced soil moisture, or saturation varies through time. According to our measurements, the saturation was greater June than in November. In particular, it seems that there was less water in the subsurface in November under the south-westernmost basin. In other words, the soil under this basin was less saturated in November than in June. Quantitative interpretation can be provided by further numerical modeling we are now developing.
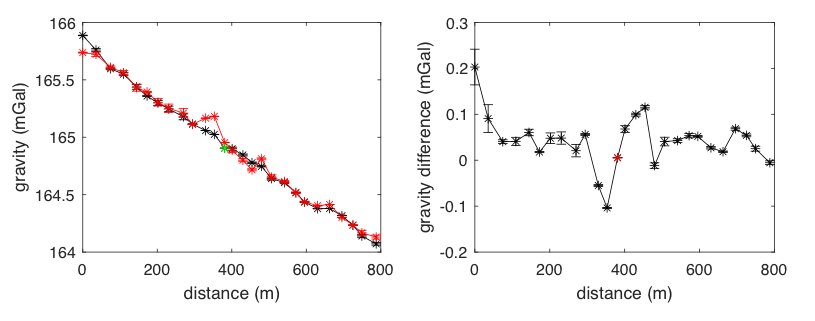
Figure 2: Gravity change along the West-East (WE) profile. E to the right, W to the left. A) red: first measures in June 2017, black, gravity measured in November 2017. The base station is reported in green. B) difference: values from November – values from June. The base station is reported in red.
Although time-lapse gravimetry cannot replace piezometers when high-precision measurements of the water table are required, it offers several advantages and an ccomplement classical well studies. The main advantages of hydrogravimetry are: (i) the method is non-invasive, (ii) it is often cheaper than drilling boreholes, and (iii) it has a larger support scale than piezometric measurements in boreholes. Moreover, changes in hydraulic head tell us only the direction of storage change, i.e. increase or decrease, and nothing about the amount of storage change. Monitoring of gravity change compliments monitoring of hydraulic head by providing a direct measure of aquifer storage change.
Having spent most of my working years as a ground water geologist I find your investings facinating and valuable.
Great work! In the early 1970’s I was involved in a gravity survey across the Amargosa Valley in the vicinity of Death Valley Junction, CA. The purpose was to approximate the groundwater resource in the valley. It would certainly be interesting to repeat those measurements at the same surveyed locations today.
Well well. I use your writing in my proposal