by Jaymelynn Farney, Beef Systems Specialist, Parsons
Mother nature has been rather fickle for the past 365 days, in Kansas we have seen flooding, droughts, blizzards, extreme heat, extreme winds, and hail, to name some of the biggest events. According to Kansas Mesonet data there was 15 inches of rainfall (October 1, 2018 to October 1, 2019) in Grant county (Southwest; average annual rainfall 12 inches) while Parsons (Southeast; average annual rainfall 42 inches) has seen 70 inches of rainfall in that same time period. With all these extremes in weather, our forages have shown quite a bit of variability in quality.
There are numerous factors that influence forage quality. Table 1 outlines what effects might have impacted plant growth, harvest, and what we may anticipate about the harvested forages nutritional quality. Additionally, after the long, cold winter of 2018-2019, many producers fed their entire supply of harvested forages and in attempt to replenish supplies may have been less selective in what to harvest. For example, hay was harvested from pastures after being grazed (largely stems and seeds heads), from pastures with mature forage, or mis-managed pastures. Hay from these sources might not exceed wheat straw in quality.
Now what? Since there is a wide variety of weather events that can impact forage quality, prior to winter feeding, it will more than pay to test hay for nutrient composition. An investment of $15-60 per sample for forage analysis gets rid of the guesswork and allows for proper balancing of diets. For example, a 1,400-pound mature cow in the last 1/3 of pregnancy needs 2.1 pounds/day of protein. If you assumed a book value of 8.33% crude protein for sudangrass then cows have enough protein to meet requirements (at a 30 pound of dry matter intake); however, if hay forage analysis says crude protein was actually 4.5% then you are underfeeding protein by 0.71 pounds/day. The protein deficiency will negatively affect colostrum, calving ability, and/or condition. Many times we think additional protein is all that needs to be supplied over the winter, but with some of the forages tested this year, that is not the case. For example, that same 1,400-pound mature, pregnant cow in the last trimester needs 14.5 pounds of TDN per day. Book value of 54.5 % TDN for sudangrass (Table 2) offers enough energy to meet cow requirements (assuming intake of 30 lbs DM), however, if TDN content is only 43.3, cows are short 1.25 pounds TDN per day. Depending on the length of time feeding this hay, cows may lose enough body condition prior to calving to once again impact ease of calving, colostrum quality and potentially re-breeding that following spring. Table 2 is a summary of some of the average forage values that have been received through extension offices in the Southeast and Central portion of the state for hay harvested this year as well as the “normal book value” of the forages. As the table summarizes, some of the average values match with “book values” however the ranges are very large for each of the measures reported.
How soon can I see a return on investment of my forage test? Take a forage you assumed was 6% crude protein but was actually 7% crude protein. Since you assumed 6% crude protein you develop a supplement program of providing 1.4 pounds of a 20% supplement that cost $400/ton. The supplement cost for 60 days is $16.80/cow. If you have more than 2 cows, you have more than covered the cost of the test (basic nutrient test ~$15 plus shipping) in supplement savings.
Table 1: Impact of weather on forage growth, harvest and potential forage quality
|
Event |
Forage |
Harvesting |
forage quality |
|
Excessive rain |
Plants mature more rapidly |
Hay harvest delayed |
Increased lignin and fiber; lower protein, and energy values |
|
Less nitrogen available(?) |
Hay yield affected (? – no change to negative) |
Leached soil nitrogen may reduce forage crude protein |
|
|
Minimal dry days between rains |
Forage is correct maturity for harvest |
Hay baled too wet or rained on in windrow |
Molds may form; bales heat and damages protein |
|
More than adequate rain and temperatures |
Plants grew very well |
High biomass (tonnage) harvested |
lower protein and energy, more lignin (Figure 1) |
|
High weed populations |
Weeds harvested with desirable forage |
Weeds unpalatable and dilutes nutritional quality |
|
|
Weeds harvested with desirable forage |
high nitrate in weeds limit forage use |
||
|
Weeds take longer to dry than grasses |
Molds decrease palatability and produce toxins; bales head and damage protein |
||
|
Drought |
Slow plant growth, maturity delayed |
Low hay yield |
Quality, especially protein tends to be higher (Figure 1) |
|
Stress impairs plant nitrogen use |
Hay harvested as normal |
High nitrates forage in some species |
Table 2: Average and ranges (in italics) of nutrient content (DM basis) of 2019 forage samples from southeastern and central Kansas, book values (in shaded rows).
| Hay type (# samples in averages) |
Crude protein, % |
TDN1, % |
NEm2 |
Neg3 |
| Alfalfa (29) |
18.91 |
57.57 |
0.56 |
0.30 |
|
10.1 – 25.3 |
48.4 – 67.7 |
0.41 – 0.76 |
0.17 – 0.43 |
|
| Alfalfa hay4 |
19 |
55.2 |
0.52 |
0.27 |
| Bermuda (5) |
8.49 |
52.46 |
0.48 |
0.23 |
|
6.78 – 9.82 |
50.07 – 56.11 |
0.44 – 0.53 |
0.19 – 0.28 |
|
| Bermudagrass hay4 |
11.1 |
56.3 |
0.53 |
0.28 |
| Crabgrass (2) |
7.62 |
44.62 |
0.35 |
0.11 |
|
6.95 – 8.28 |
43.65 – 45.58 |
0.33 – 0.38 |
0.09 – 0.14 |
|
| Crabgrass harvested every 49 days5 |
11 |
54.8 |
Not reported |
|
| Fescue (3) |
8.64 |
50.17 |
0.44 |
0.19 |
|
7.08 – 11.73 |
46.44 – 52.33 |
0.38 – 0.47 |
0.14 – 0.22 |
|
| Fescue hay4 |
9.22 |
58.3 |
0.56 |
0.30 |
| Mixed grass (8) |
6.56 |
48.52 |
0.47 |
0.17 |
|
4.17 – 10.59 |
38.98 – 42.65 |
0.26 – 0.56 |
0.02 – 0.23 |
|
| Native prairie hay4 |
6.76 |
48.4 |
0.41 |
0.17 |
| Sudangrass (4) |
7.53 |
43.38 |
0.33 |
0.09 |
|
4.52 – 10.87 |
38.41 – 47.71 |
0.25 – 0.40 |
0.01 – 0.16 |
|
| Sudangrass4 |
8.33 |
54.5 |
0.51 |
0.25 |
| 1 TDN, total digestible nutrients
2 NEm stands for net energy for maintenance in megacalories per pound on dry matter basis 3 NEg stands for net energy for gain in megacalories per pound on dry matter basis 4 Shaded rows are “book values” from Nutrient Requirements of Beef Cattle, 8th Revised Edition (2016) 5 Beck et al., 2007. J. Anim. Sci. 85:527-535 |
||||
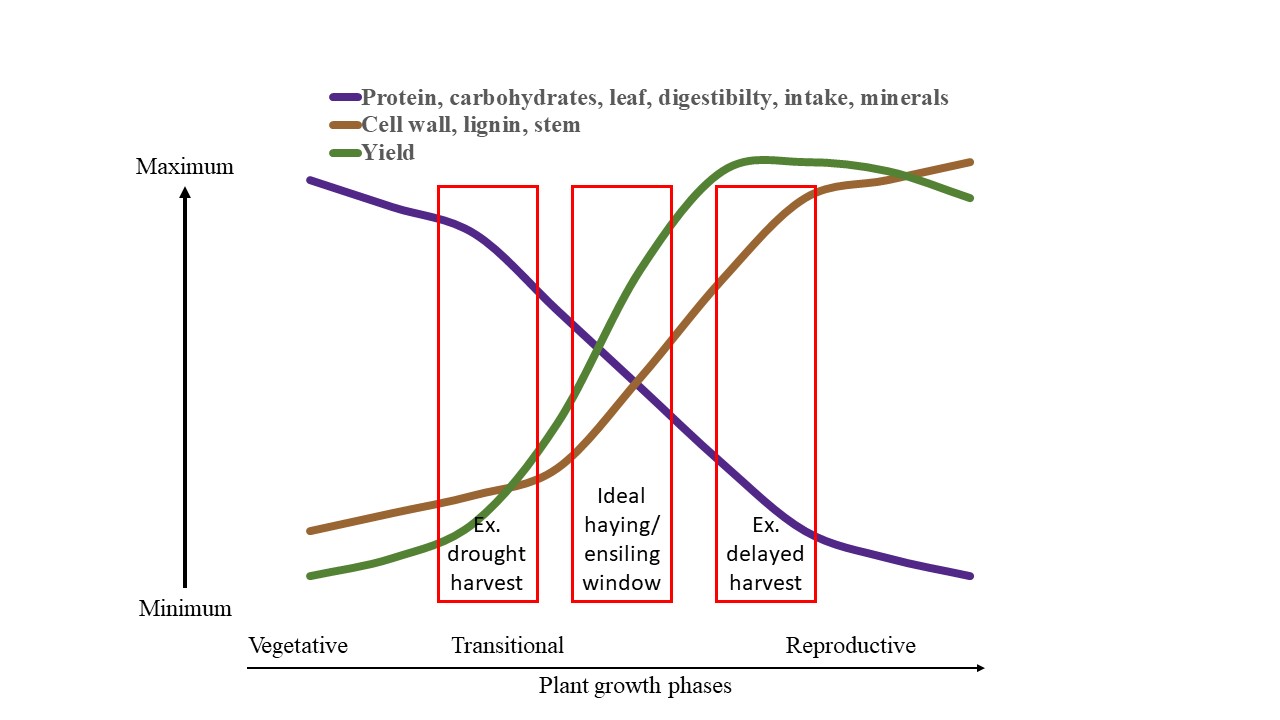
Figure 1: Trends in forage biomass, quality, and plant composition with stage of plant production
This figure demonstrates the inverse relationship between yield and forage nutrient content (protein, energy, minerals, digestibility, etc). Ideal hay/ensiling time occurs when trying to optimize yield and forage quality. Some examples of what yield and quality might be in forage based on drought conditions (box on left) or delayed harvest (box on right), are illustrated in the figure