Qualtrics, a survey tool available to all K-State faculty and staff, has many uses for assessment. The video below details several ways Qualtrics can facilitate direct and indirect assessment across a variety of situations, including:
- Gathering data from internships
- Transitioning evaluation processes from paper forms to electronic means
- Facilitating project and dissertation defense processes
For additional information or assistance in setting up Qualtrics to meet your assessment needs, contact the Office of Assessment at assessment@ksu.edu.
Additional videos can be found on our YouTube channel.
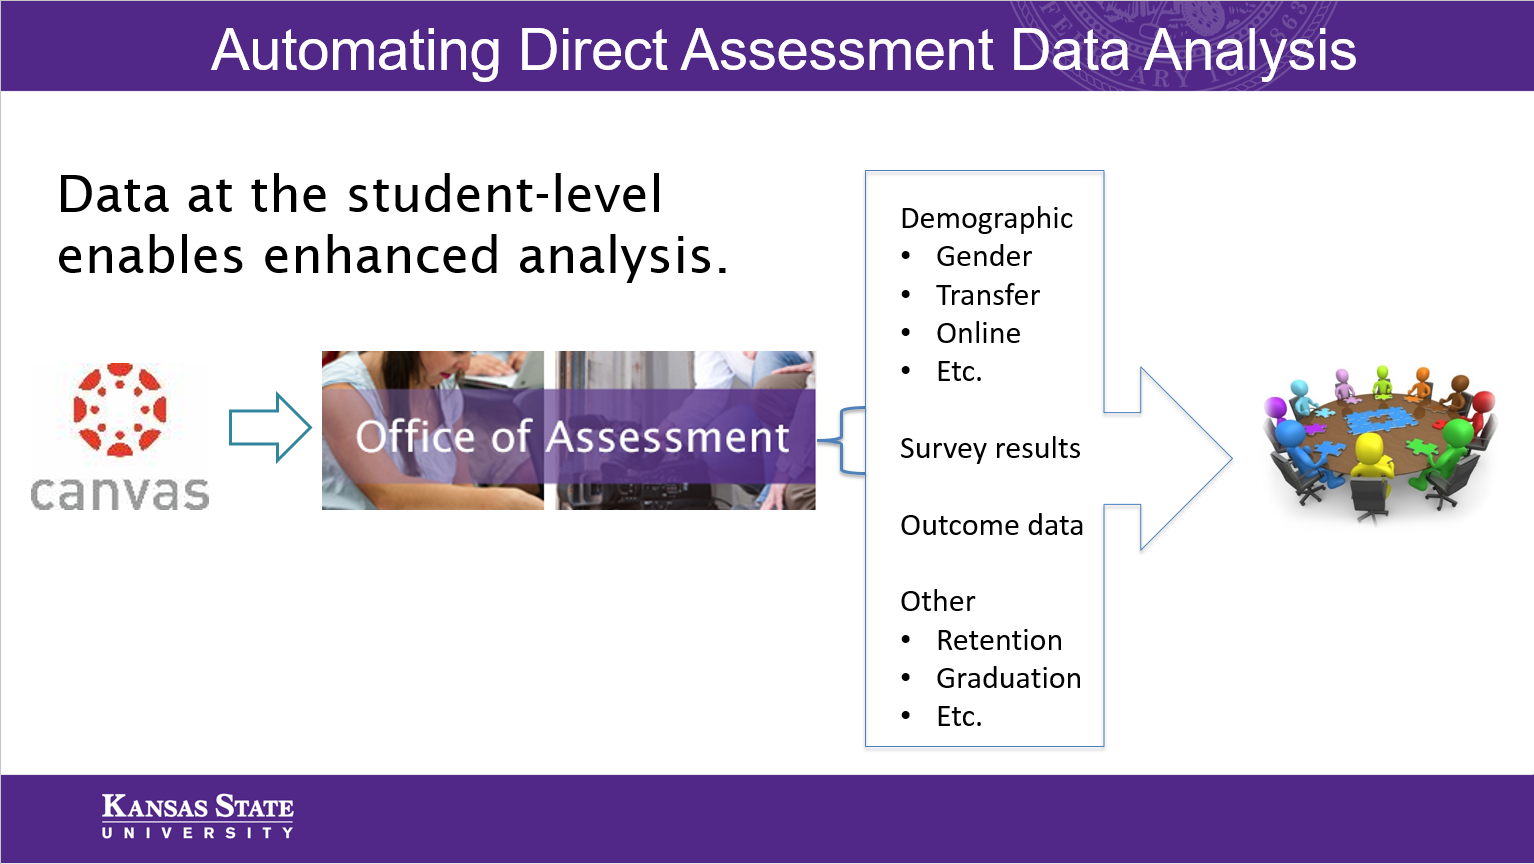 The Office of Assessment can help programs implement these new tools and design custom reports that meet the program’s needs. This article describes using Canvas to collect data, but other options are available. The key is that assessment data is gathered at the student level, which enables connection to other student indicators and metrics.