An earlier post presented a conceptual overview of using Canvas Outcomes scores in PowerBI. Today, we are presenting a four-part, step-by-step walkthrough detailing how to create a direct assessment dashboard/report in PowerBI. These videos present a variety of options for each step and are meant to be adapted to fit each user’s needs.
The first video in the series covers the creation of the Fact Table using outcomes data exported from Canvas.
Continue reading “Assessment Dashboard in a Day Video Walkthrough: Part I – The Fact Table”
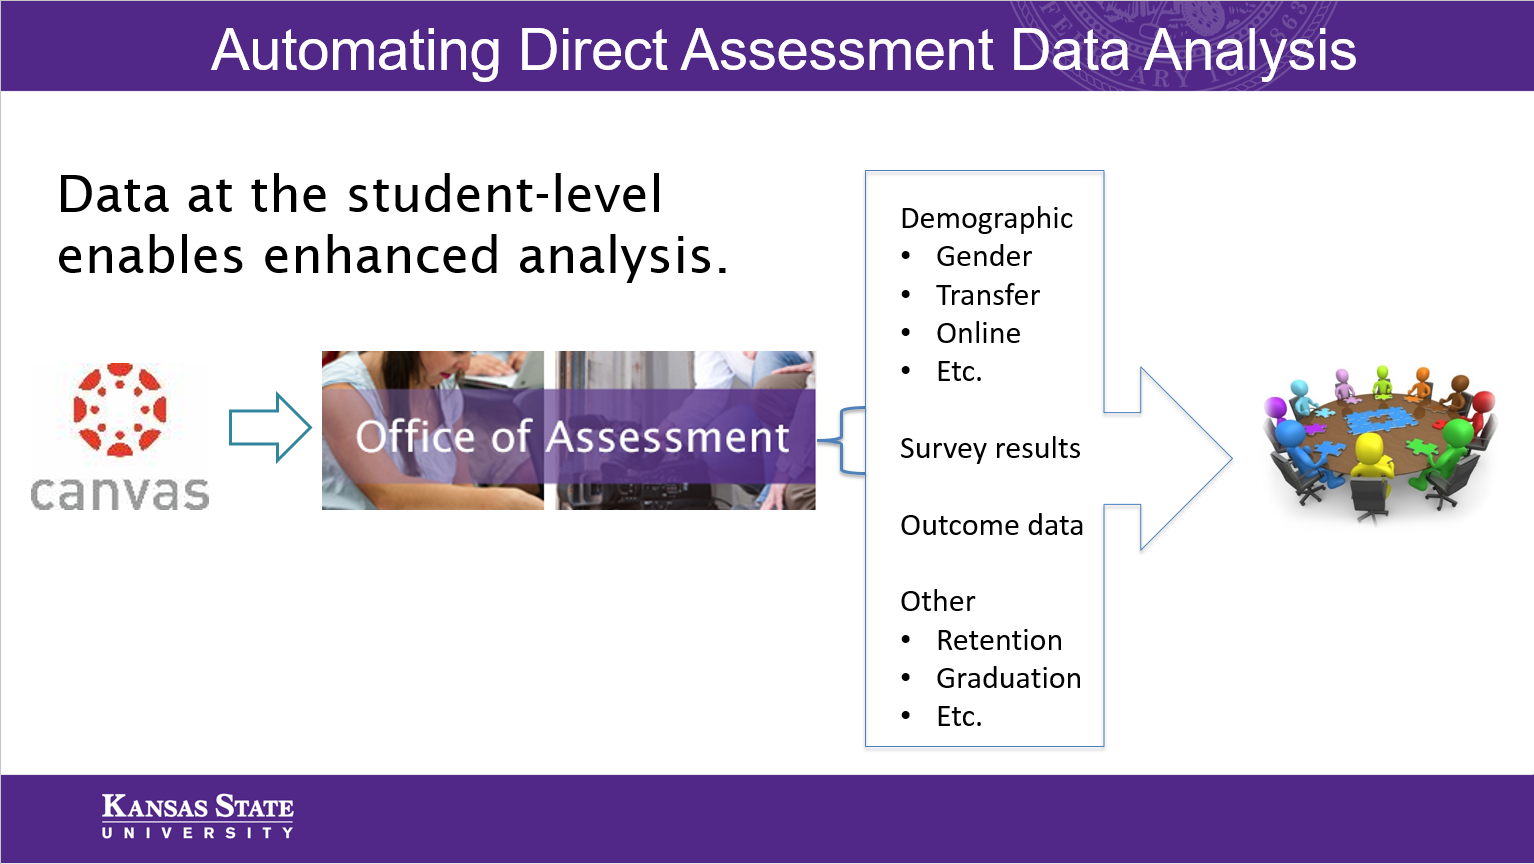 The Office of Assessment can help programs implement these new tools and design custom reports that meet the program’s needs. This article describes using Canvas to collect data, but other options are available. The key is that assessment data is gathered at the student level, which enables connection to other student indicators and metrics.